Air Pollution RESEARCH
This resource is designed to allow primary children (ages 9-11) to investigate atmospheric pollution using Defra's Air Data Archive
Climate change and surface air quality are two of the most pressing global concerns as we move through the 21st Century. The impact of air quality on human health is well documented as is the disproportionate impact on the health of the very young and very old. This project provides detailed resources which will allow primary age children, teachers, carers and parents to interrogate the UK Air Data Archives from which they may carry out their own research using freely available data.
OVERVIEW
We have provided a set of resources to support primary teachers who are interested in climate change and want to explore the topic of air pollution with children. The resources will enable children to develop their science enquiry skills and maths skills whilst learning about air quality and air pollution, namely:
- Asking questions that can be answered by exploring real scientific data;
- Making predictions using existing knowledge of human behaviour and air quality;
- Setting up enquiries - delve into the database to investigate pollutant levels in their area and across the U.K.;
- Developing maths skills - calculate mean avaerages, plot graphs, and interpret line graphs and scatter graphs;
- Using spreadsheets;
- Interpreting and communicating results - interpret trends in data from different cities in the UK and from different years;
- Evaluating - reflect on issues surrounding climate change and identify further questions for enquiry.
Through working on the suggested investiations and setting up some of their own, it is hoped that children will appreciate the sources of air pollutants, the impact of air pollutants, why scientists measure air pollutants; and how we might reduce the effect of air pollution in the future.
The UK’s Air Data Archive, one of the most extensive in the world, is run by the Department for Environment, Food and Rural Affairs (Defra), a UK Government department. It contains some 400 million data points. Therefore, a project that utilises this amazing UK resource and allows primary school children, their teachers, parents and other stakeholders to learn about and carry out investigations into air pollutants is a great starting point for a citizen science project.
There are many potential and exciting investigations that can be undertaken. For example, What is the most polluted day in the year?
The graph below shows the levels of four pollutants at Marylebone Road, London, measured in the first part of November 2018. You will see that the most polluted day is usually around Bonfire Night (5th November).
Acknowledgements
This project was developed through a Biotechnology and Biological Sciences Research Council (BBSRC) Research Grant (BB/T018933/1) awarded to Professor Dudley Shallcross (University of Bristol) under the title ‘Using the UK Air Quality Archive in Primary Schools.’ This project was further extended thanks to support from a portfolio of research grants awarded to the Atmospheric Chemistry Research Group (ACRG) at the School of Chemistry, University of Bristol.
These resources have been developed by Professor Dudley Shallcross, Tim Harrison (Bristol ChemLabS) and Dr Alison Trew (PSTT Fellow) with assistance from Dr Jonny Furze, Dr Anwar Khan, Rayne Holland and Dr James Matthews (Atmospheric Chemistry Reserach Group, University of Bristol), and Sue Martin (PSTT Programme Director).
CLASSROOM RESOURCES
What is air?
Depending on the children's prior knowledge, we suggest that you start with this PowerPoint presentation which explains the concepts of chemicals, gases, and air, and suggests activities that help children understand what air is. There are notes with each slide which give background information and answers to questions that you might ask the children.
pptx
Gases in the Air
The Gases in the Air science assembly has been performed over 1400 times in primary schools. The talk demonstrates some of the properties of the gases in our atmosphere (nitrogen, oxygen, carbon dioxide, hydrogen and helium) and uses experiments to introduce correct terminology and to show what is, and what is not, a chemical change.
The complete assesmbly has now been recorded and is available here, performed by Tim Harrison and filmed & edited by Dr Jonny Furze, Bristol ChemLabS, University of Bristol, UK. The film lasts 48 minutes but could be watched in shorter sections.
Note: the film contains some loud bangs and popping balloons.
What is pollution?
This PowerPoint has 4 sections:
- What is pollution?
- What causes air pollution?
- How do air pollutants affect humans and the environment?
- Why do scientists measure air pollutants?
There are notes with each slide which give background information and answers to questions that you may ask the children.
pptx
PPT1B. What is pollution? [1.73MB]
Classroom presentation: introducing the concept of pollution, air pollutants and how these affect humans and the environment.
What does BIG data look like?
This PowerPoint presentation is designed for children who already have some knowledge of the causes and possible effects of air pollution, and different types of air pollutants. The slides provide real data in the form of graphs from the Air Quality Data Archive. There are notes with each slide which give background information and answers to questions that you might ask the children. You might want to select part/all of it to provide children with experience of data analysis before using the UK Air Data Archive for your own research.
pptx
PPT2. What does BIG data look like? [1.86MB]
Classroom presentation: 8 graphs showing levels of different air pollutants.
What do levels of air pollutants look like across the UK?
This classroom presentation provides real data (in the form of tables and graphs) from sites across England, Scotland, Wales and Northern Ireland, and questions to support children's learning. You might want to select all/part of it to provide children with experience of data analysis before using the UK Air Data Archive for your own research. There are notes with each slide that give background information and answers to questions that you might ask the children.
Note: Teachers may also want to print Belfast 2010 data tables and Big Graph Templates so that children have the opportunity to plot real scientific data. Indiviually plotted fortnightly data can be joined to create a mega graph showing how pollutant levels change across the year.
pptx
PPT3. What do levels of air pollutants look like across the UK? [1.49MB]
Classroom presentation: 10 graphs showing real data from England, Wales, Scotland and Northern Ireland.
Data tables - Belfast 2010 [157.53kB]
26 tables of data: nitrogen dioxide levels in consecutive 14-day periods which could be used to produce a class graph.
What can children investigate?
Once children are familiar with air pollutants, and what air quality data looks like, they could carry out their own investigations. For example:
- What is the most polluted day and the cleanest day in one of the capital cities (London, Cardiff, Edinburgh or Belfast)?
- How do levels of air pollutants compare in different cities?
- How do levels of air pollutants vary from month to month, or year to year?
- How did the levels of air pollutants vary during the 2020 lockdowns compared with previous years?
To help teachers and children explore these questions, we have created pre-prepared data sets (see zipped files below). There are spreadsheets (Excel), for the four capital cities of the home nations (Belfast, Cardiff, Edinburgh and London) and for a clean air (countryside) site (Auchencorth Moss, Scotland). We have taken data for the years 2010, 2012, 2014, 2016, 2018 and 2020. Only data on the main atmospheric pollutants have been extracted (nitrogen dioxide, nitric oxide, carbon monoxide, sulfur dioxide, PM2.5 and PM10).
Note: Each Air Quality Datasheet shows some of the raw data. The data was extracted from the Air Quality Archive (2010-2018 obtained 30-31 March 2020, 2020 obtained March 2021).
You will also find examples of graphs within some of the data sheets showing a few of the many possible ways of looking at the information:
- For 
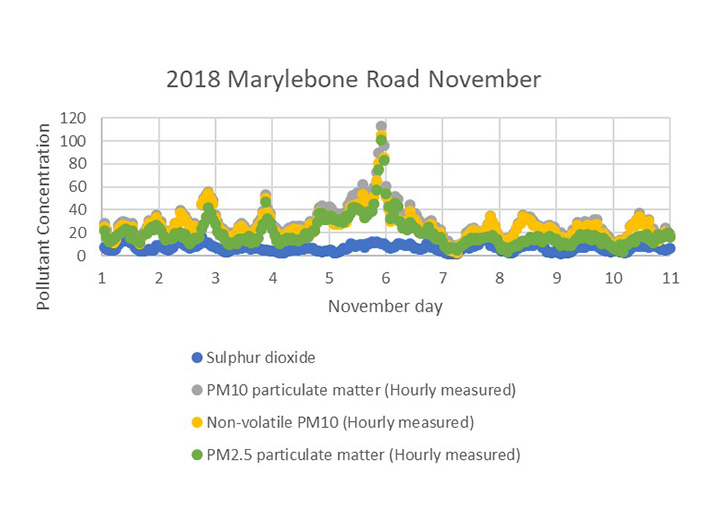
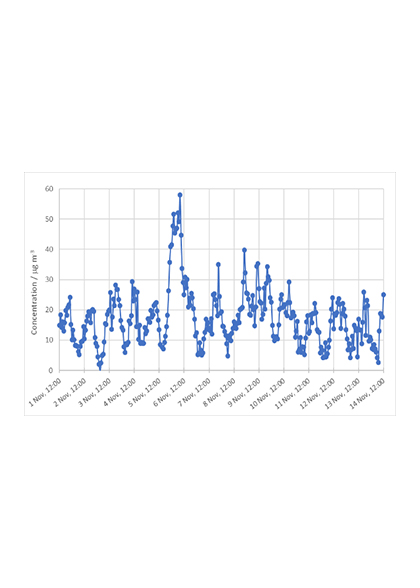
London (Marylebone Road) 2012 (London Olympics Year) - each major pollutant is reproduced on successive sheets. On each sheet an average per month was calculated so that subsequent 'rough' plots of both yearly and monthly data could be generated. (‘Rough’, because the axes were not titled, no units were given (apart from in the legend) and an inaccurate graph title was used.) The type of plot you might want to use is up to you. On the particulates PM2.5 sheet, the daily average hourly data for the year (days numbered rather than dates given) was plotted, as was the monthly average.
- For Cardiff 2018 - yearly graphs of air pollutants PM2.5 and PM10 are presented as daily levels and average monthly levels for comparison of clarity.
- For Edinburgh 2018 - air pollutants and PM2.5/10 graphs are produced for August, November, and December, for identifying trends across different months.
- For Belfast 2018 - air pollutant and PM2.5/10 fortnightly data tables, for plotting data.
- For 2020, some graphs are provided for all sites. Students may be interested to investigate the levels of air pollutants during the Covid-19 lockdowns 1, 2 or 3.
For an explanation of the symbols and units of measurement used in the data sets, download Extracted Data Sets: explanatory notes
zip
zip
zip
Edinburgh Air Quality data [380.73kB]
2010, 2012, 2014, 2016, 2018*, 2020* (*includes graphs)
zip
Belfast Air Quality data [381.67kB]
2010**, 2012, 2014, 2016, 2018, 2020* (*includes graphs, **includes fortnightly NO2 data tables)
zip
Clean Air Scotland Air Quality data [233.58kB]
2010, 2012, 2014, 2016, 2018, 2020* (*includes graphs)
What happened to levels of air pollutants during national lockdown in 2020?
A 'stand-alone' classroom presentation provides a brief look at levels of air pollutants in cities around the UK before and after the COVID-19 lockdown was introduced on 23 March 2020. Slide notes give background information and answers to questions that you might ask the children.
Spreadsheets containing air quality data from 2020 from all four capital cities and a clean air site are provided for further investigations.
pptx
PPT4. What happened to levels of air pollutants during national lockdown in 2020? [1.94MB]
Classroom presentation: 6 graphs comparing air quality data from January to May in both 2019 and 2020.
What can we do?
This classroom presentation explains how changes in human behaviour and some current technologies could reduce carbon emission levels.
pptx
PPT5. What can we do? [3.58MB]
Classroom presentation challenges children to pledge to act to reduce atmospheric carbon levels.
Writing tasks for primary children
There are many ways that children can write about what they have learned about atmospheric pollutants, air quality and climate change. We have suggested some activities which cover a range of genres in Writing Tasks for Primary Children.
Writing tasks [264.80kB]
Using the UK Air Data Archive
After using some of the pre-prepared data sets (provided under the RESOURCES tab), children may want to investigate the levels of atmospheric pollutants nearer to where they live. Teachers can access data themselves from the UK Air Data Archive. Step-by-step guidance on how to do this is provided in Using the UK Air Data Archive (both Word and PowerPoint versions are available). Graphical data or tabulated data from sites around the UK can be freely downloaded. Some children may be able to search the data archive themselves.
We suggest that you start by selecting a site near to your setting. These are some of the questions that you might like to investigate:
- What is the most polluted day and cleanest day of the year? - select data from the previous full year (January to December).
- How does the mean (average) value of a specific pollutant vary on different days of the week? Is there a pattern? Why? - select data from one week.
- How do levels vary from month to month? - select data from one year.
- How do levels vary from year to year? - select data from a ten-year or twenty-year period.
- How did the levels of pollutants change during the COVID-19 lockdown compared with the previous year?
Using the UK Air Data Archive for your own research
Step-by-step guidance on accessing data from the UK Air Data Archive
pptx
Using the UK Air Data Archive for your own research
Step-by-step guidance on accessing data from the Air Data Archive
MEET THE SCIENTISTS
To introduce modern scientists into your lessons and to assist in demonstrating that science is carried out by a diverse range of people, we asked climate scientists to provide a short profile of their role in science research. These are intended for sharing with children and could be used for guided reading or general discussions.
SUPPLEMENTARY RESOURCES FOR TEACHERS
For further information, teachers may be interested in reading or listening to the Background Information on Atmospheric Pollutants and Air Quality which describes types of air pollutants, the effects of air pollutants, how they are measured, and gives examples of data.
For enthusiasts, we have also provided these resources (see below):
- An Overview of the Atmosphere - Everything you wanted to know about the air pollution but were afraid to ask!
- An Overview of Climate Change - An explanation of climate change and stabilisation wedges.
- Background reading list - Climate information for teachers: a list of recent publications.
- Molecular nitrogen (N2) - an article from School Science Review*, issue 375, Jan 2020.
- Molecular oxygen (O2) - an article from School Science Review*, issue 375, Jan 2020.
*We are most grateful to the Association of Science Education (ASE) for allowing us to make these articles free to download and would encourage you to look at School Science Review as it is an excellent resource for secondary and primary school teachers.
mp3
pptx
An Overview of the Atmosphere and Air Pollution [4.35MB]
This presentation is intended for interested teachers, not primary children.
pptx
An Overview of Climate Change [1.65MB]
This presentation is intended for interested teachers, not primary children.
Background Reading List [198.70kB]
A list of articles written by the authors of the project 'Air Pollution Research', Prof. Dudley Shallcross and Tim Harrison.
Molecular nitrogen: inert but essential [664.40kB]
An article from School Science Review (2019)
O•, O2 and O3: the key to life on the Earth [388.95kB]
An article from School Science Review (2019)
Chemistry Review is a commercial magazine (Hodder Education) aimed at post-16 students and their teachers. Most secondary school libraries should have back copies. You may be interested in these short articles:
- Tim Harrison, Dudley Shallcross, Anwar Khan and Alison Trew. Air quality and data mining, Chemistry Review, 31(1), pp2-4, September 2021.
- Tim Harrison, Dudley Shallcross, Anwar Khan and Alison Trew. How did lockdown affect air quality? Chemistry Review, 31(1), pp26-28, September 2021.
You may also be interested in these short articles, written by climate researchers at the University of Bristol, which also include questions (with answers) for those wishing to use them as a comprehension task.
Title |
Author(s) | Topics |
Dimethylsulfide (DMS) in the Troposphere | Prof Dudley Shallcross | free radicals, climate change, oxidation, volatile organic compounds, natural products |
Reconstructing Past Climates Using Molecular Fossils | Dr Gordon Inglis | molecular fossils, climate change, biomarkers |
Leaf Cutter Ants, Farmed Fungus and Ozone Depletion | Prof Dudley Shallcross and Dr Anwar Khan | halogenoalkanes, climate change, ozone depletion, GCMS, analysis |
How are aircraft affecting our atmosphere? | Amy Foulds | contrails, climate change, NOx, free radicals |
Climate Change and Industrial Sources of FluorinatedHydrocarbons | Eleni Michalopoulou | Emissions, global warming potential, rare earths, aluminium smelting, semiconductor industry |
Tracking India’s consumption of ozone-depletingsubstances | Dr Daniel Say | Montreal Protocol, climate change, India, halocarbons,
ozone-depletion, CFC, HCFC, HFC
|
Removal of Trifluoroacetic Acid from the Atmosphere byCriegee Intermediates | Dr Rabi Chhantyal Pun | Climate change, Criegee, free radicals, computational chemistry, CFCs |
Spectroscopy and Photochemistry of AtmosphericallyRelevant Oxidants: Criegee Intermediates | Dr Barbara Marchetti | Climate change, Criegee, free radicals, ozonolysis, laser, electromagnetic spectrum, TOF |
Perfluorooctanoicacid and how anthropogenic pollutants contaminate remote environments | Rayne Holland | Pollution transport, PFCAs, free radicals, oceans |
Policingthe Atmosphere: Tracking Greenhouse Gas Emissions | Dr. Daniel Say | Greenhouse gases, climate change, modelling, Paris agreement |
Cows,Hydrogen Isotopes, and Climate Change | Susannah Smith | Ruminants, fatty acids, isotopes, climate change |