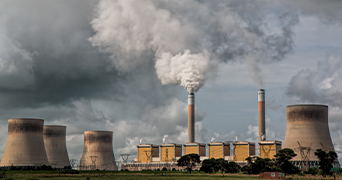
Powerplant

Post 16 Citizen Science Air Pollution

This resource is designed to allow post 16 school students to investigate atmospheric pollution using Defra’s Air Quality Archive.

Climate change and surface air quality are two of the most pressing global concerns as we move through the 21st Century

The impact of air quality on human health is well documented as is the disproportionate impact on the health of the very young and very old. This project will allow students and teachers to interrogate the air quality archives from which they may carry out their own research using freely available data.

A set of resources for primary children (ages 9-12) and secondary children (ages 11-14) to investigate atmospheric pollution using Defra’s Air Data Archive is available here.

The materials for this project have been created by Prof. D.E. Shallcross1 2 (Communicating author, dudley.shallcross@pstt.org.uk) and T.G Harrison 1.

1 Atmospheric Chemistry Research Group (ACRG), School of Chemistry, University of Bristol, UK.

2 Primary Science Teaching Trust (PSTT).

Acknowledgements

This project was developed through a Biotechnology and Biological Sciences Research Council (BBSRC) Research Grant (BB/T018933/1) awarded to Professor Dudley Shallcross (University of Bristol) under the title ‘Using the UK Air Quality Archive in Primary Schools.’

The resources have been developed by Professor Dudley Shallcross, Tim Harrison (Bristol ChemLabS) and Dr Alison Trew (PSTT Fellow) with assistance from Dr Jonny Furze, Dr Anwar Khan, Rayne Holland and Dr James Matthews (Atmospheric Chemistry Research Group, University of Bristol), and Sue Martin (PSTT Programme Director).

This project was further extended thanks to support from a portfolio of research grants awarded to the Atmospheric Chemistry Research Group (ACRG) at the School of Chemistry, University of Bristol.

Introduction

What is the Air Quality Archive?

The U.K.’s Air Quality Archive, one of the most extensive in the world, is run by the Department for Environment, Food and Rural Affairs (Defra), a U.K. government department. It contains some 400 million data points. Therefore, a project that utilises this amazing U.K. resource and allows students, their teachers, parents and other stakeholders to learn about and carry out investigations into air pollutants is a great starting point for a citizen science project.

These data are readily accessible from the website portal and contain measurements on primary pollutants such as:

  • nitrogen oxides (NO, NO2),
  • carbon monoxide (CO),
  • sulfur dioxide (SO2),
  • particulates PM5 (airborne particles with a diameter less than 2.5 µm) and PM10 (airborne particles with a diameter less than 10 µm).

The measurements are calibrated and have much supporting information in terms of how the measurements are made, where the measurements are made (e.g., by the kerbside, in an urban background location) and the instruments used to make the measurements. These data are extensive in terms of geographical coverage, with most U.K. schools having some network measurements in their vicinity.

What can students investigate?

There are many potential and exciting investigations that can be undertaken. The Atmospheric Chemistry Research Group (ACRG) at Bristol have used the archive extensively with school students to investigate the role of bonfire night on particle levels. This was a project run with secondary students and then became a full research project.

Datasets can be mined and pre-prepared so that teachers can use real scientific data with their children. This avoids issues to do with using the internet. Students can investigate and explore this data. A simple starting point would be to look at the mean (average) value of a specific pollutant on different days of the week and to determine if there is a pattern and why. They could then consider the following questions:

  • How do these levels vary from month to month, from year to year, or from location to location?
  • What hypotheses do the children give before they investigate these data and afterwards for the changes they observe?
  • What is the most polluted day and cleanest day in a (named) U.K. city?

The graph here shows the levels of sulfur dioxide, PM10 particulate matter (volatile and non-volatile), and PM2.5) at Marylebone Road, London, measured in the first part of November 2018. We have asked the last question with primary school children on many occasions and they predict a wide range of days for both, with excellent reasons. When they look at the data and see that the most polluted day is usually around bonfire night (5th November) and the cleanest day is Christmas Day (25th December), they make some excellent connections.

For enthusiasts

For the more adventurous, more open exploration of the database is possible. Here is a an opportunity for students in schools, and families, to carry out meaningful science investigations, and for adults to engage and understand about pollutant levels in their area and more widespread across the U.K. This citizen science opportunity is not just limited to students of school age.

Conducting a citizen science project on Air Pollutants and Air Quality

All the resources you need are freely downloadable below.

Before starting your research

We suggest that you read the Background Information on Atmospheric Pollutants and Air Quality. For more details on air pollutants and climate change, further information is provided under Supplementary Resources.

Using Pre-prepared data sets

We have prepared data sets (Excel spreadsheets) for the four capital cities of the home nations (Belfast, Cardiff, Edinburgh and London) and from a clean air (countryside) site (Auchencorth Moss, Scotland) for the years 2010, 2012, 2014, 2016, 2018 and 2020. The data was extracted from the Air Quality Archive (2010-2018 obtained 30-31 March 2020, 2020 obtained March 2021). Only data on the main atmospheric pollutants have been extracted. You can access the data from each site individually (see the zipped files below).

You will find the data sheet for London (Marylebone) 2012 as a worked example showing a few of the many possible ways of looking at the information.

An explanation of the symbols and units of measurement used in the data sets is given below, see Extracted Data Sets: explanatory notes.

Students may be interested to investigate the levels of air pollutants during the Covid-19 lockdowns 1, 2 or 3. We have provided an additional spreadsheet containing air quality data extracted from January to June 2020 for the 4 capital cities and the same clean air site mentioned above.

Distance Teaching Project Plan

We have provided an 8-week Distance Learning Project Plan aimed at post-16 students.

It is assumed that students will know how to use the web, Power Point (or similar), manipulate spreadsheets and can organise web conferencing. We suggest a 1-hour weekly teacher contact session (by web link) to guide the students through the resource and tasks to be set, and 2-4 hours per week independent learning or group learning with students working in small groups to discuss their findings.

Carrying out your own research

After using some of the pre-prepared data sets, you may want to investigate the levels of atmospheric pollutants nearer to where you live. You can access data from the UK Air Data Archive. Step-by-step guidance on how to do this is provided in Using the UK Air Data Archive (both Word and Power Point versions are available). You will be able to download graphical data or tabulated data from sites around the U.K.

These are some of the questions that you might like to investigate:

  • What is the most polluted day and cleanest day of the year? – select data from the previous full year (January to December).
  • How does the mean (average) value of a specific pollutant vary on different days of the week? Is there a pattern? Why? – select data from one week.
  • How do levels vary from month to month? – select data from one year.
  • How do levels vary from year to year? – select data from a ten-year or twenty-year period.

Resources

Background Information on Atmospheric Pollutants and Air Quality

What data is there and what does it mean? Information for post-16 students.

Download

Extracted Data Sets: Explanatory Notes

Guidance on using the extracted data sets and a worked example from London 2012.

Download

Extracted Data Sets: Belfast

2010, 2012, 2014, 2016, 2018, 2020.

Download

Extracted Data Sets: Cardiff

2010, 2012, 2014, 2016, 2018, 2020.

Download

Extracted Data Sets: Edinburgh

2010, 2012, 2014, 2016, 2018, 2020.

Download

Extracted Data Sets: London

2010, 2012, 2014, 2016, 2018, 2020
2012 contains worked examples of different pollutants.

Download

Extracted Data Sets: Clean Air (Auchencorth Moss, Scotland)

2010, 2012, 2014, 2016, 2018, 2020.

Download

Project Plan for Distance Learning

An 8-week project plan for post-16 students learning about Air Quality.

Download

Using the UK Data Archive for Your Own Research

Step-by-step guidance on accessing data from the UK Air Data Archive.

Download

Meet the scientists

Meet Eleni

To introduce modern scientists into your lessons and to assist in demonstrating that science is carried out by a diverse range of people, we asked climate scientists to provide a short profile of their role in scientific research. These are intended for sharing with children and could be used for guided reading or general discussions.

Click on the button here to ‘meet’ Eleni Michalopoulou.

There are twelve more scientists’ profiles below.

Meet Eleni
Eleni

Meet the scientists

Portrait of Rabi Chhantyal

Dr Rabi Chhantyal-Pun

Download
Portrait of Mike Coleman

Prof. Mike Davies-Coleman

Download
Dr Aoife Grant

Dr Aoife Grant

Download
Tim Harrison

Tim Harrison

Download
Rayne Holland

Rayne Holland

Download
Portrait of Anwar Khan

Dr MD Anwar Hossain Khan

Download
Warren Joubert

Warren Joubert

Download
Dr Brett Kuyper

Dr Brett Kuyper

Download
Dr James Matthews

Dr James Matthews

Download
Dr Alecia Nickless

Dr Alecia Nickless

Download
Prof. Dudley Shallcross

Prof. Dudley Shallcross

Download
Dr Steve Utembe

Dr Steve Utembe

Download

For post-16 students

A Pollutant’s Tale

You may be interested in a chemistry demonstration video – A Pollutant’s Tale.

This atmospheric chemistry and climate change lecture has been performed over 2500 times in various formats and is intended for post-16 students. It has now been recorded and is available here.

The lecture covers:

  • the composition of the Earth’s atmosphere in comparison to other planets
  • a brief description of the structure of the atmosphere
  • investigation of some of the chemistry and properties of nitrogen and oxygen
  • a few of the tropospheric pollutants including carbon dioxide

Throughout the lecture there are demonstrations including some involving liquid nitrogen, oxygen foam, dry ice, and a few explosions.

Performed by Tim Harrison and Professor Dudley Shallcross. Filmed & edited by Dr. Jonny Furze. All are from Bristol ChemLabS, University of Bristol, UK.

Watch video

For post-16 students

Gases in the air

Another lecture demonstration/science assembly on the topic ‘Gases in the Air’ considers some of the science behind the main gases in our atmosphere. This recording was performed for Key Stage 3 and can be accessed here.

Watch video

Further information

An Overview of the Atmosphere & Air Pollution

Everything you wanted to know about air pollution but were too afraid to ask.

Download

Volatile Organic Compounds

Download

A Simple Climate Model

A deeper look at climate models.

Download

Stabilisation Wedges

More details about stabilisation wedges.

Download

Background Reading List

Climate information - a reading list for interested teachers.

Download

Molecular Nitrogen: Inert but Essential

An article from School Science Review (2019).

Download

O., O2 and O3: the Key to Life on the Earth

An article from School Science Review (2019).

Download

Safety Notice & Disclaimer

The PSTT advises teachers to refer to either the CLEAPSS website or SSERC website for up to date health and safety information when planning practical activities for children.

The PSTT is not liable for the actions or activities of any reader or anyone else who uses the information in these resource pages or the associated classroom materials. The PSTT assumes no liability with regard to injuries or damage to property that may occur as a result of using the information contained in these resources. The PSTT recommends that a full risk assessment is carried out before undertaking in the classroom any of the practical investigations contained in the resources.

All materials are ©Primary Science Teaching Trust (PSTT) and are freely available to download and share for educational purposes. Whilst educators are free to adapt the resources to suit their own needs, acknowledgement of copyright on all original materials must be included. Rights to images included in the resource have been purchased for PSTT use only – as such, these images may only be used as part of this resource and may not copied into or used in other materials.